Split debugging info -- symbols

In a previous post I mentioned split debugging info.

One addendum to this is how symbols are handled. Symbols are separate to debugging info (i.e. the stuff about variable names, types, etc you get when -g is turned on), but necessary for a good debugging experience.

You have a choice, however, of where you leave the symbol files. You can leave them in your shipping binary/library so that users who don't have the full debugging info available will still get a back-trace that at least has function names. The cost is slightly larger files for everyone, even if the symbols are never used. This appears to be what Redhat does with it's system libraries, for example.

The other option is to keep the symbols in the .debug files along-side the debug info. This results in smaller libraries, but really requires you to have the debug info files available to have workable debugging. This appears to be what Debian does.

So, how do you go about this? Well, it depends on what tools you're using.

For binutils strip, there is some asynchronicity between the --strip-debug and --only-keep-debug options. --strip-debug will keep the symbol table in the binary, and --only-keep-debug will also keep the symbol table.

$ gcc -g -o main main.c
$ readelf --sections ./main | grep symtab
  [36] .symtab           SYMTAB          00000000 000f48 000490 10     37  53  4
$ cp main main.debug
$ strip --only-keep-debug main.debug
$ readelf --sections ./main.debug | grep symtab
  [36] .symtab           SYMTAB          00000000 000b1c 000490 10     37  53  4
$ strip --strip-debug ./main
$ readelf --sections ./main.debug | grep symtab
  [36] .symtab           SYMTAB          00000000 000b1c 000490 10     37  53  4

Of course, you can then strip (with no arguments) the final binary to get rid of the symbol table; but other than manually pulling out the .symtab section with objcopy I'm not aware of any way to remove it from the debug info file.

Constrast with elfutils; more commonly used on Redhat based system I think.

eu-strip's --strip-debug does the same thing; leaves the symtab section in the binary. However, it also has a -f option, which puts any removed sections during the strip into a separate file. Therefore, you can create any combination you wish; eu-strip -f results in an empty binary with symbols and debug data in the .debug file, while eu-strip -g -f results in debug data only in the .debug file, and symbol data retained in the binary.

The only thing to be careful about is using eu-strip -g -f and then further stripping the binary, and consequently destroying the symbol table, but retaining debug info. This can lead to some strange things in backtraces:

$ gcc -g -o main main.c
$ eu-strip -g -f main.debug main
$ strip ./main
$ gdb ./main
GNU gdb (GDB) 7.1-debian
...
(gdb) break foo
Breakpoint 1 at 0x8048397: file main.c, line 2.
(gdb) r
Starting program: /home/ianw/tmp/symtab/main

Breakpoint 1, foo (i=100) at main.c:2
      2return i + 100;
(gdb) back
#0  foo (i=100) at main.c:2
#1  0x080483b1 in main () at main.c:6
#2  0x423f1c76 in __libc_start_main (main=Could not find the frame base for "__libc_start_main".
) at libc-start.c:228
#3  0x08048301 in ?? ()

Note one difference between strip and eu-strip is that binutils strip will leave the .gnu_debuglink section in, while eu-strip will not:

$ gcc -g -o main main.c
$ eu-strip -g -f main.debug main
$ readelf --sections ./main| grep debuglink
  [29] .gnu_debuglink    PROGBITS        00000000 000bd8 000010 00      0   0  4
$ eu-strip main
$ readelf --sections ./main| grep debuglink
$ gcc -g -o main main.c
$ eu-strip -g -f main.debug main
$ strip main
$ readelf --sections ./main| grep debuglink
  [27] .gnu_debuglink    PROGBITS        00000000 0005d8 000010 00      0   0  4
Separate debug info

I've recently found out a bit more about separating debug info, and thought a consolidated reference might be handy.

The Idea

Most every distribution now provides separate debug packages which contain only the debug info, saving much space for the 99% of people who never want to start gdb.

This is achieved with objcopy and --only-keep-debug/--add-gnu-debuglink and is well explained in the man page.

What does this do?

This adds a .gnu_debuglink section to the binary with the name of debug file to look for.

$ gcc -g -shared -o libtest.so libtest.c
$ objcopy --only-keep-debug libtest.so libtest.debug
$ objcopy --add-gnu-debuglink=libtest.debug libtest.so
$ objdump -s -j .gnu_debuglink libtest.so

libtest.so:     file format elf32-i386

Contents of section .gnu_debuglink:
 0000 6c696274 6573742e 64656275 67000000  libtest.debug...
 0010 52a7fd0a                             R...

The first part is the name of the file, the second part is a check-sum of debug-info file for later reference.

Build ID

Did you know that binaries also get stamped with a unique id when they are built? The ld --build-id flag stamps in a hash near the end of the link.

$ readelf --wide --sections ./libtest.so  | grep build
  [ 1] .note.gnu.build-id NOTE            000000d4 0000d4 000024 00   A  0   0  4
$ objdump -s -j .note.gnu.build-id libtest.so

libtest.so:     file format elf32-i386

Contents of section .note.gnu.build-id:
 00d4 04000000 14000000 03000000 474e5500  ............GNU.
 00e4 a07ab0e4 7cd54f60 0f5cf66b 5799b05c  .z..|.O`.\.kW..\
 00f4 2d43f456                             -C.V

Incase you're wondering what the format of that is...

uint32 name_size; /* size of the name */
uint32 hash_size; /* size of the hash */
uint32 identifier; /* NT_GNU_BUILD_ID == 0x3 */
char   name[name_size]; /* the name "GNU" */
char   hash[hash_size]; /* the hash */

Although the actual file may change (due to prelink or similar) the hash will not be updated and remain constant.

Finding the debug info files

The last piece of the puzzle is how gdb attempts to find the debug-info files when it is run. The main variable influencing this is debug-file-directory.

(gdb) show debug-file-directory
The directory where separate debug symbols are searched for is "/usr/lib/debug".

The first thing gdb does, which you can verify via an strace, is search for a file called [debug-file-directory]/.build-id/xx/yyyyyy.debug; where xx is the first two hexadecimal digits of the hash, and yyy the rest of it:

$ objdump -s -j .note.gnu.build-id /bin/ls

/bin/ls:     file format elf32-i386

Contents of section .note.gnu.build-id:
 8048168 04000000 14000000 03000000 474e5500  ............GNU.
 8048178 c6fd8024 2a11673c 7c6a5af6 2c65b1b5  ...$*.g<|jZ.,e..
 8048188 d7e13fd4                             ..?.

... [running gdb /bin/ls] ...

access("/usr/lib/debug/.build-id/c6/fd80242a11673c7c6a5af62c65b1b5d7e13fd4.debug", F_OK) = -1 ENOENT (No such file or directory)

Next it moves onto the debug-link info filename. First it looks for the filename in same directory as the object being debugged. After that it looks for the file in a sub-directory called .debug/ in the same directory.

Finally, it prepends the debug-file-directory to the path of the object being inspected and looks for the debug info there. This is why the /usr/lib/debug directory looks like the root of a file-system; if you're looking for the debug-info of /usr/lib/libfoo.so it will be looked for in /usr/lib/debug/usr/lib/libfoo.so.

Interestingly, the sysroot and solib-search-path don't appear to have anything to do with these lookups. So if you change the sysroot, you also need to change the debug-file-directory to match.

However, most distributions make all this "just work", so hopefully you'll never have to worry about anyway!

Go L4!

By now everybody has now heard about Go, Google's expressive, concurrent, garbage collecting language. One big, glaring thing stuck out at me when I was reading the documentation:

Do not communicate by sharing memory; instead, share memory by communicating.

One of the examples given is a semaphore using a channel, which I'll copy here for posterity.

var sem = make(chan int, MaxOutstanding)

func handle(r *Request) {
    sem <- 1;    // Wait for active queue to drain.
    process(r);  // May take a long time.
    <-sem;       // Done; enable next request to run.
}

func Serve(queue chan *Request) {
    for {
        req := <-queue;
        go handle(req);  // Don't wait for handle to finish.
    }
}

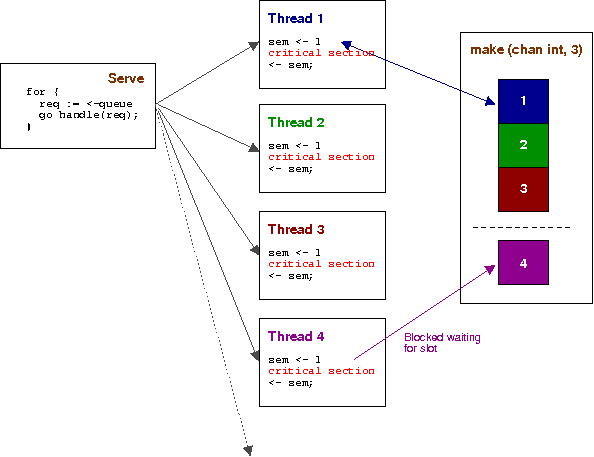
Here is a little illustration of that in operation.

Semaphores with Google Go

Serve creates goroutines via the go keyword; each of which tries to get a slot in the channel. In the example there are only 3 slots, so it acts like a semaphore of count 3. When done, each thread returns its slot to the channel, which allows anyone blocked to be woken and continued.

This instantly reminded me of the very first thing you need to do if you ever want to pass Advanced Operating Systems -- write a semaphore server to provide synchronisation within your OS.

In L4, threads communicate with each other via inter-process communication (IPC). IPC messages have a fixed format - you specify a target thread, bundle some data into the available slots in the IPC format and fire it off. By default you block waiting for a reply -- this all happens within a single call for efficiency. On the other side, you can write servers who are listening for remote IPC connections, where everything happens in reverse.

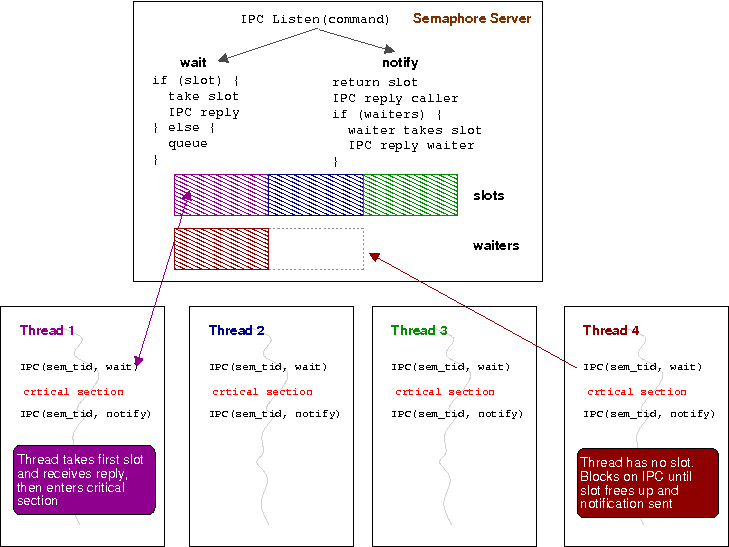
Here's another illustration the of the trivial semaphore server concept Shehjar and I implemented.

L4 semaphore server example

Look familiar? Instead of a blocking push of a number into a slot into a channel, you make a blocking IPC call to a remote server.

My point here is that both take the approach of sharing memory via communication. When using IPC, you bundle up all your information into the available slots in the IPC message and send it. When using a channel, you bundle your information into an entry in the channel and call your goroutine. Receiving the IPC is the same as draining a channel - both result in you getting the information that was bundled into it by the caller.

IPC Go
Start thread Start goroutine
New thread blocks listening for IPC message Goroutine blocks draining empty channel
Bundle information into IPC message Bundle data into type of your channel
Send IPC to new thread Push data into channel
Remote thread unbundles IPC goroutine drains channel and gets data

Whenever you mention the word "microkernel", people go off the deep-end and one thing they seem to forget about is the inherent advantages of sharing state only via communication. As soon as you do that, you've broken open an amazing new tool for concurrency, which is now implicitly implied. By communicating via messages/channels rather than shared global state, it doesn't matter where you run! One of those threads in the example could be running on another computer in your cloud, marshalling up it's IPC messages/channel entries and sending them over TCP/IP -- nobody would care!

At any rate, do not communicate by sharing memory; instead, share memory by communicating is certainly an idea whose time has come.

Quickly describing hash utilisation

I think the most correct way to describe utilisation of a hash-table is using chi-squared distributions and hypothesis and degrees of freedom and a bunch of other things nobody but an actuary remembers. So I was looking for a quick method that was close-enough but didn't require digging out a statistics text-book.

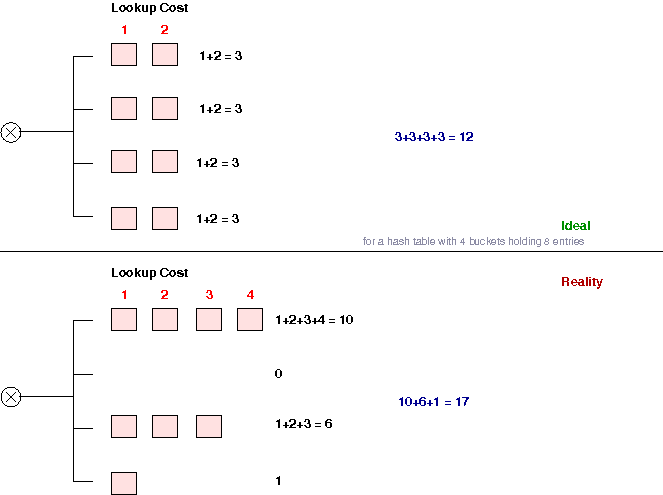
I'm sure I've re-invented some well-known measurement, but I'm not sure what it is. The idea is to add up the total steps required to look-up all elements in the hash-table, and compare that to the theoretical ideal of a uniformly balanced hash-table. You can then get a ratio that tells you if you're in the ball-park, or if you should try something else. A diagram should suffice.

Scheme for acquiring a hash-utilisation ratio

This seems to give quite useful results with a bare minimum of effort, and most importantly no tricky floating point math. For example, on the standard Unix words with a 2048 entry hash-table, the standard DJB hash came out very well (as expected)

Ideal 2408448
Actual 2473833
----
Ratio 0.973569

To contrast, a simple "add each character" type hash:

Ideal 2408448
Actual 6367489
----
Ratio 0.378241

Example code is hash-ratio.py. I expect this measurement is most useful when you have a largely static bunch of data for which you are attempting to choose an appropriate hash-function. I guess if you are really trying to hash more or less random incoming data and hence only have a random sample to work with, you can't avoid doing the "real" statistics.

On Complexity

> Fools ignore complexity. Pragmatists suffer it. Some can avoid it. > Geniuses remove it.

Alan J. Perlis, Eipgrams on Programming, SIGPLAN Notices Vol. 17, No. 9, September 1982, pages 7-13.

Why symbol visibility is good

ELF has two related concepts for managing symbols in your programs. The first concept is the symbol binding. Global binding means the symbol is visible outside the file being built; local binding is the opposite and keeps the symbol local only (static) and weak is like global, but suggests that the symbol can be overridden.

$ cat syms.c
static int local(void) { }

int global(void) { }

int  __attribute__((weak)) weak(void) { }

$ gcc -o syms -c syms.c

$ readelf --syms ./syms

Symbol table '.symtab' contains 10 entries:
   Num:    Value  Size Type    Bind   Vis      Ndx Name
...
     5: 00000000     8 FUNC    LOCAL  DEFAULT    1 local
     8: 00000008     8 FUNC    GLOBAL DEFAULT    1 global
     9: 00000010     8 FUNC    WEAK   DEFAULT    1 weak
...

This is all well and good, but starts breaking down when you want to load many different modules and keep strict API's (such as, say, dynamic libraries!).

Consider that for two files to share a common function, the function must end up with a global visibility.

$ cat file1.c
void common_but_not_part_of_api(void) { }

$ cat file2.c
extern void common_but_not_part_of_api(void);

void api_function(void) {
     common_but_not_part_of_api();
}

$ gcc -shared -fPIC  -o library file1.c file2.c
$ readelf --syms ./library

Symbol table '.symtab' contains 60 entries:
   Num:    Value  Size Type    Bind   Vis      Ndx Name
...
    53: 00000424    29 FUNC    GLOBAL DEFAULT   11 api_function
    55: 0000041c     5 FUNC    GLOBAL DEFAULT   11 common_but_not_part_of_api
...

In the example above, both the function we want exported (api_function) and the function we don't wish exported (common_but_not_part_of_api) end up with exactly the same attributes. Binding attributes are useful for the linker putting together object files; but aren't a complete solution.

To combat this, ELF provides for visibility attributes. Symbols can be default, protected, hidden or internal. Using these attributes, we can flag extra information for the dynamic loader so it can know which symbols are for public consumption, and which are for internal use only.

The most logical way to use this is to make all symbols by default hidden with -fvisibility=hidden and then "punch holes in the wall" for those symbols you want visible.

$ cat file1.c
void common_but_not_part_of_api(void) { }

$ cat file2.c
extern void common_but_not_part_of_api(void);

void  __attribute__((visibility("default"))) api_function(void) {
      common_but_not_part_of_api();
}

$ gcc -fvisibility=hidden -shared -fPIC  -o library file1.c file2.c
$ readelf --syms ./library

Symbol table '.symtab' contains 60 entries:
   Num:    Value  Size Type    Bind   Vis      Ndx Name
    48: 000003cc     5 FUNC    LOCAL  HIDDEN   11 common_but_not_part_of_api
    54: 000003d4    29 FUNC    GLOBAL DEFAULT  11 api_function

Now the dynamic loader has enough information to distinguish between the two, and can stop any external access to common_but_not_part_of_api easily.

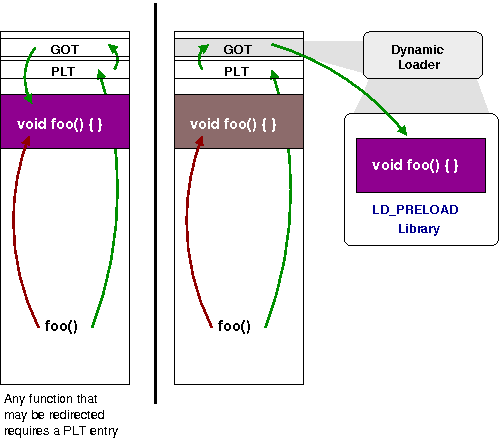
This extra information also has potential for performance improvements. Any time a symbol may be overridden, the compiler must generate a program lookup table (PLT) entry for the function so that the dynamic loader can re-direct the function call. The PLT is a trampoline which gets the correct address of the function being called (from the global offset table, GOT) and bounces the function call to the right place. An example should illustrate:

Bouncing via the PLT

In the first example, there was not enough information to tell if the function would ever be able to be overridden, hence a PLT entry had to be created and the function called through it (disassemble it to see the details!). With correct symbol visibility attributes, there is enough information to know that common_but_not_part_of_api is never to be overridden, hence the PLT (and the associated costs of trampolining) can be avoided.

The internal attribute is even stricter; it says that this function will never be called from outside this module (for example, we might pass the address of common_but_not_part_of_api to anyone). This can lead to even better code, because on many architectures transitioning to another module might involve flipping global pointer registers or other similarly expensive operations.

So that's how symbol binding and visibility attributes can work together to get you the best performance possible from your program!

Whoda' thunk it!

I learned a new word today, thunk. At first, given the context, I thought it meant text (as in program code) hunk, but the Hacker's Dictionary suggests it's actually more a term for a closure.

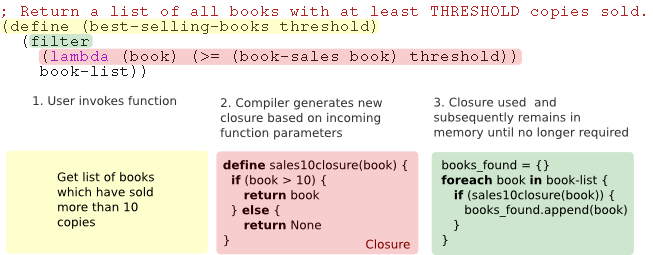
For those not familiar with what a closure is, it's a "thunk" of encapsulated code created by the compiler which is dynamically generated and managed. Stealing the Wikipedia example:

Closures

Nested functions are probably the closest thing to a closure you can get with C (I've talked about nested functions and trampolines before). However, because the stack disappears it's not nearly as useful, I think the term for these is lexical closures, because it's basically a way to share some stack and restrict name-spaces.

Amusingly, the code using the term "thunk" was assembler, so my first search was for thunk gas (as in GNU Assembler). This of course lead to endless articles on the high price of gas — a non-renewable fossil fuel running out and capitalists realising inelastic demand can be used to line their pockets? Whoda' thunk it!

Short review of guarded page-tables

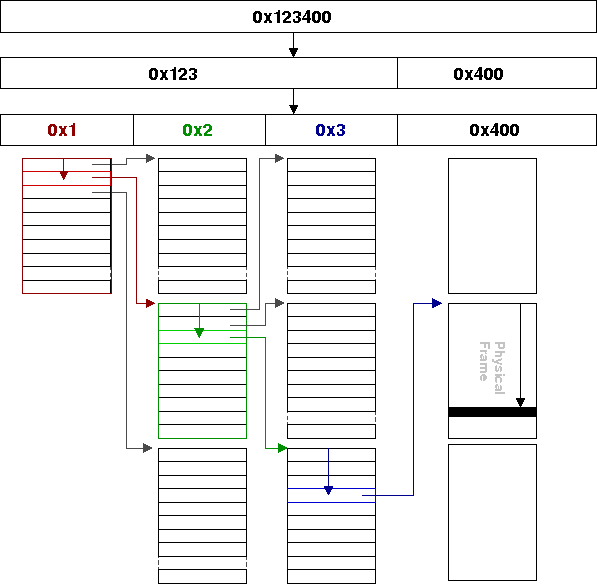
Anyone who has done an operating systems 101 course is familiar with the standard hierarchical page-table structure. This is essentially a radix-tree where bits of the virtual address are taken as indexes into an array of pointers, each pointing to the next level down or, at the leaves, to a physical entry.

Hierarchical page-table

One potential issue with this style of page-table is with a very large, very sparse address space (such as in a single address-space operating system) there will be many intermediate steps with possibly only a single translation at the end (i.e. lots of single pages scattered all around your address-space).

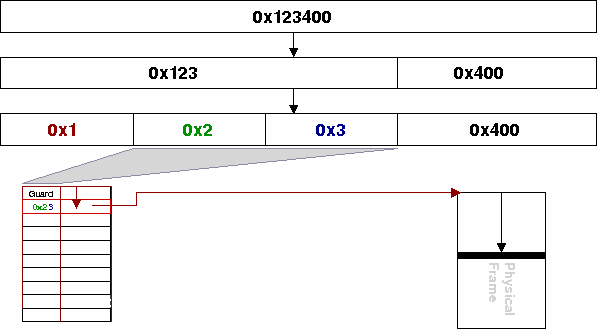
Thus we can add a bit-field guard to each of the entries in the page table (Liedtke, 1994) to help indicate only those paths through the tree which are valid (similar to a Patricia tree).

Translation first proceeds as usual; the top bits are used as an index into the top level table. However, each entry now contains extra information about further valid addresses. The guard is masked against the next bits in the virtual address; if it matches (e.g. in our example is 0x2) the next step can proceed directly to the leaf node, bypassing the middle look-up. The entry can be marked as either final (i.e. pointing to a leaf node) or intermediate, in which case the process continues with the next level (which also has its own guard, and so forth). Any entry that does not match the guard is known to be false, and therefore a fault can be raised.

Hierarchical page-table with guard

To examine this further, consider that we know that each page in our 24-bit address space above is 4KiB, thanks to the 212 = 4KiB offset. Therefore each of the 16 possible values of the top four bits selects 1MiB of the 224 = 16MiB address space; e.g. 0x0 selects the first megabyte, 0x1 the second and so forth. The second 4 bits selects a 64KiB region of this 1MiB, and the last 4 bits selects a 4KiB region of this 64KiB region.

This scheme could work quite well if we were using only 16 pages each separated by 1MiB. Each of these pages would only require an entry in the top level with an appropriate guard which could then be marked as final and point directly to a physical frame.

Once things become less sparse however, we need to start filling in middle levels. If you have 2 pages within a 16MiB region, you need at least one extra bit of address to tell them apart. If you have 3 or 4 pages, you need at least 2 bits to tell them apart, and so forth.

It would therefore be beneficial to have variable level sizes to dynamically adapt and create the most efficient lookup possible given the address space layout of a process. For example, if you knew your process was only going map pages 0x123 (100100011) and 0x124 (100100100) a good option would be to make your top-level only two entries (i.e. check the top bit) with a guard on the entry at index 0x1 of 00100. You then need a second level with 8 pointers to differentiate the remaining 3 bits (each of these would be final and hence point directly to a physical page).

The more pages you start mapping, the less bits you can discard with the guard. If you follow this through to a guard of 0 bits you end up with a linear page-table.

It has been shown (Elphinstone, 1999) that fixed level sizes with 16 entries tends to work well. For a 32-bit address-space with 4KiB pages (e.g. 12 bits offset) this leaves 20 bits to be mapped by the page-tables; with each level mapping 24 bits this means a 5 level tree. The guard values provide enough path-compression that the table is not constantly walked. The disadvantage is that it may "over-allocate" meaning more space is dedicated to page-tables than strictly required.

Deciding where and when to split levels, what size indexes to put at each level and updating all the guard values dynamically to make the smallest, most efficient page-table would create a variable-radix page-table (Szmajda and Heiser, 2003).

In summary, a guarded page-table is more useful the more sparse your address space is. A variable-radix guarded page-table is complex, but could offer advantages for implementing variable page-size support and thus having positive effects on TLB coverage.